Example: Deploying PHP Guestbook application with Redis
This example shows how to build a simple, multi-tier web application using Kubernetes and Docker.
Table of Contents
- Guestbook Example
The example consists of:
- A web frontend
- A redis master (for storage), and a replicated set of redis ‘slaves’.
The web frontend interacts with the redis master via javascript redis API calls.
Note: If you are running this example on a Google Container Engine installation, see this Google Container Engine guestbook walkthrough instead. The basic concepts are the same, but the walkthrough is tailored to a Container Engine setup.
Prerequisites
This example requires a running Kubernetes cluster. First, check that kubectl is properly configured by getting the cluster state:
$ kubectl cluster-info
If you see a url response, you are ready to go. If not, read the Getting Started guides for how to get started, and follow the prerequisites to install and configure kubectl. As noted above, if you have a Google Container Engine cluster set up, read this example instead.
All the files referenced in this example can be downloaded from GitHub.
Quick Start
This section shows the simplest way to get the example work. If you want to know the details, you should skip this and read the rest of the example.
Start the guestbook with one command:
$ kubectl create -f guestbook/all-in-one/guestbook-all-in-one.yaml
service "redis-master" created
deployment "redis-master" created
service "redis-slave" created
deployment "redis-slave" created
service "frontend" created
deployment "frontend" created
Alternatively, you can start the guestbook by running:
$ kubectl create -f guestbook/
Then, list all your Services:
$ kubectl get services
NAME           CLUSTER-IP   EXTERNAL-IP   PORT(S)    AGE
frontend       10.0.0.117   <none>        80/TCP     20s
redis-master   10.0.0.170   <none>        6379/TCP   20s
redis-slave    10.0.0.201   <none>        6379/TCP   20s
Now you can access the guestbook on each node with frontend Service’s <Cluster-IP>:<PORT>, e.g. 10.0.0.117:80 in this guide. <Cluster-IP> is a cluster-internal IP. If you want to access the guestbook from outside of the cluster, add type: NodePort to the frontend Service spec field. Then you can access the guestbook with <NodeIP>:NodePort from outside of the cluster. On cloud providers which support external load balancers, adding type: LoadBalancer to the frontend Service spec field will provision a load balancer for your Service. There are several ways for you to access the guestbook. You may learn from Accessing services running on the cluster.
Clean up the guestbook:
$ kubectl delete -f guestbook/all-in-one/guestbook-all-in-one.yaml
or
$ kubectl delete -f guestbook/
Step One: Start up the redis master
Before continuing to the gory details, we also recommend you to read Kubernetes concepts and user guide. Note: The redis master in this example is not highly available. Making it highly available would be an interesting, but intricate exercise — redis doesn’t actually support multi-master Deployments at this point in time, so high availability would be a somewhat tricky thing to implement, and might involve periodic serialization to disk, and so on.
Define a Deployment
To start the redis master, use the file redis-master-deployment.yaml, which describes a single pod running a redis key-value server in a container.
Although we have a single instance of our redis master, we are using a Deployment to enforce that exactly one pod keeps running. E.g., if the node were to go down, the Deployment will ensure that the redis master gets restarted on a healthy node. (In our simplified example, this could result in data loss.)
The file redis-master-deployment.yaml defines the redis master Deployment:
apiVersion: extensions/v1beta1
kind: Deployment
metadata:
  name: redis-master
  # these labels can be applied automatically
  # from the labels in the pod template if not set
  # labels:
  #   app: redis
  #   role: master
  #   tier: backend
spec:
  # this replicas value is default
  # modify it according to your case
  replicas: 1
  # selector can be applied automatically
  # from the labels in the pod template if not set
  # selector:
  #   matchLabels:
  #     app: guestbook
  #     role: master
  #     tier: backend
  template:
    metadata:
      labels:
        app: redis
        role: master
        tier: backend
    spec:
      containers:
      - name: master
        image: gcr.io/google_containers/redis:e2e
        resources:
          requests:
            cpu: 100m
            memory: 100Mi
        ports:
        - containerPort: 6379
Define a Service
A Kubernetes Service is a named load balancer that proxies traffic to one or more containers. This is done using the labels metadata that we defined in the redis-master pod above. As mentioned, we have only one redis master, but we nevertheless want to create a Service for it. Why? Because it gives us a deterministic way to route to the single master using an elastic IP.
Services find the pods to load balance based on the pods’ labels.
The selector field of the Service description determines which pods will receive the traffic sent to the Service, and the port and targetPort information defines what port the Service proxy will run at.
The file redis-master-service.yaml defines the redis master Service:
apiVersion: v1
kind: Service
metadata:
  name: redis-master
  labels:
    app: redis
    role: master
    tier: backend
spec:
  ports:
    # the port that this service should serve on
  - port: 6379
    targetPort: 6379
  selector:
    app: redis
    role: master
    tier: backend
Create a Service
According to the config best practices, create a Service before corresponding Deployments so that the scheduler can spread the pods comprising the Service. So we first create the Service by running:
$ kubectl create -f guestbook/redis-master-service.yaml
service "redis-master" created
Then check the list of services, which should include the redis-master:
$ kubectl get services
NAME              CLUSTER-IP       EXTERNAL-IP       PORT(S)       AGE
redis-master      10.0.76.248      <none>            6379/TCP      1s
This will cause all pods to see the redis master apparently running on <CLUSTER-IP>:<PORT>. A Service can map an incoming port to any targetPort in the backend pod. Once created, the Service proxy on each node is configured to set up a proxy on the specified port (in this case port 6379).
targetPort will default to port if it is omitted in the configuration. targetPort is the port the container accepts traffic on, and port is the abstracted Service port, which can be any port other pods use to access the Service. For simplicity’s sake, we omit it in the following configurations.
The traffic flow from slaves to masters can be described in two steps:
- A redis slave will connect to
porton the redis master Service - Traffic will be forwarded from the Service
port(on the Service node) to thetargetPorton the pod that the Service listens to.
For more details, please see Connecting applications.
Finding a Service
Kubernetes supports two primary modes of finding a Service — environment variables and DNS.
Environment variables
The services in a Kubernetes cluster are discoverable inside other containers via environment variables.
DNS service
An alternative is to use the cluster’s DNS service, if it has been enabled for the cluster. This lets all pods do name resolution of services automatically, based on the Service name.
This example has been configured to use the DNS service by default.
If your cluster does not have the DNS service enabled, then you can use environment variables by setting the
GET_HOSTS_FROM env value in both
redis-slave-deployment.yaml and frontend-deployment.yaml
from dns to env before you start up the app.
(However, this is unlikely to be necessary. You can check for the DNS service in the list of the cluster’s services by
running kubectl --namespace=kube-system get rc -l k8s-app=kube-dns.)
Note that switching to env causes creation-order dependencies, since Services need to be created before their clients that require env vars.
Create a Deployment
Second, create the redis master pod in your Kubernetes cluster by running:
$ kubectl create -f guestbook/redis-master-deployment.yaml
deployment "redis-master" created
You can see the Deployment for your cluster by running:
$ kubectl get deployments
NAME           DESIRED   CURRENT   UP-TO-DATE   AVAILABLE   AGE
redis-master   1         1         1            1           27s
Then, you can list the pods in the cluster, to verify that the master is running:
$ kubectl get pods
You’ll see all pods in the cluster, including the redis master pod, and the status of each pod. The name of the redis master will look similar to that in the following list:
NAME                            READY     STATUS    RESTARTS   AGE
redis-master-2353460263-1ecey   1/1       Running   0          1m
...
(Note that an initial docker pull to grab a container image may take a few minutes, depending on network conditions. A pod will be reported as Pending while its image is being downloaded.)
kubectl get pods will show only the pods in the default namespace. To see pods in all namespaces, run:
kubectl get pods --all-namespaces
For more details, please see Configuring containers and Deploying applications.
Optional Interlude
You can get information about a pod, including the machine that it is running on, via kubectl describe pods/<POD-NAME>. E.g., for the redis master, you should see something like the following (your pod name will be different):
$ kubectl describe pods redis-master-2353460263-1ecey
Name:		redis-master-2353460263-1ecey
Node:		kubernetes-node-m0k7/10.240.0.5
...
Labels:		app=redis,pod-template-hash=2353460263,role=master,tier=backend
Status:		Running
IP:		10.244.2.3
Controllers:	ReplicaSet/redis-master-2353460263
Containers:
  master:
    Container ID:	docker://76cf8115485966131587958ea3cbe363e2e1dcce129e2e624883f393ce256f6c
    Image:		gcr.io/google_containers/redis:e2e
    Image ID:		docker://e5f6c5a2b5646828f51e8e0d30a2987df7e8183ab2c3ed0ca19eaa03cc5db08c
    Port:		6379/TCP
...
The Node is the name and IP of the machine, e.g. kubernetes-node-m0k7 in the example above. You can find more details about this node with kubectl describe nodes kubernetes-node-m0k7.
If you want to view the container logs for a given pod, you can run:
$ kubectl logs <POD-NAME>
These logs will usually give you enough information to troubleshoot.
However, if you should want to SSH to the listed host machine, you can inspect various logs there directly as well. For example, with Google Compute Engine, using gcloud, you can SSH like this:
me@workstation$ gcloud compute ssh <NODE-NAME>
Then, you can look at the Docker containers on the remote machine. You should see something like this (the specifics of the IDs will be different):
me@kubernetes-node-krxw:~$ sudo docker ps
CONTAINER ID        IMAGE                                 COMMAND                 CREATED              STATUS              PORTS                   NAMES
...
0ffef9649265        redis:latest                          "/entrypoint.sh redi"   About a minute ago   Up About a minute                           k8s_master.869d22f3_redis-master-dz33o_default_1449a58a-5ead-11e5-a104-688f84ef8ef6_d74cb2b5
If you want to see the logs for a given container, you can run:
$ docker logs <container_id>
Step Two: Start up the redis slave
Now that the redis master is running, we can start up its ‘read slaves’.
We’ll define these as replicated pods as well, though this time — unlike for the redis master — we’ll define the number of replicas to be 2. In Kubernetes, a Deployment is responsible for managing multiple instances of a replicated pod. The Deployment will automatically launch new pods if the number of replicas falls below the specified number. (This particular replicated pod is a great one to test this with – you can try killing the Docker processes for your pods directly, then watch them come back online on a new node shortly thereafter.)
Just like the master, we want to have a Service to proxy connections to the redis slaves. In this case, in addition to discovery, the slave Service will provide transparent load balancing to web app clients.
This time we put the Service and Deployment into one file. Grouping related objects together in a single file is often better than having separate files. The specification for the slaves is in all-in-one/redis-slave.yaml:
apiVersion: v1
kind: Service
metadata:
  name: redis-slave
  labels:
    app: redis
    role: slave
    tier: backend
spec:
  ports:
    # the port that this service should serve on
  - port: 6379
  selector:
    app: redis
    role: slave
    tier: backend
---
apiVersion: extensions/v1beta1
kind: Deployment
metadata:
  name: redis-slave
  # these labels can be applied automatically
  # from the labels in the pod template if not set
  # labels:
  #   app: redis
  #   role: slave
  #   tier: backend
spec:
  # this replicas value is default
  # modify it according to your case
  replicas: 2
  # selector can be applied automatically
  # from the labels in the pod template if not set
  # selector:
  #   matchLabels:
  #     app: guestbook
  #     role: slave
  #     tier: backend
  template:
    metadata:
      labels:
        app: redis
        role: slave
        tier: backend
    spec:
      containers:
      - name: slave
        image: gcr.io/google_samples/gb-redisslave:v1
        resources:
          requests:
            cpu: 100m
            memory: 100Mi
        env:
        - name: GET_HOSTS_FROM
          value: dns
          # If your cluster config does not include a dns service, then to
          # instead access an environment variable to find the master
          # service's host, comment out the 'value: dns' line above, and
          # uncomment the line below.
          # value: env
        ports:
        - containerPort: 6379
This time the selector for the Service is app=redis,role=slave,tier=backend, because that identifies the pods running redis slaves. It is generally helpful to set labels on your Service itself as we’ve done here to make it easy to locate them with the kubectl get services -l "app=redis,role=slave,tier=backend" command. For more information on the usage of labels, see using-labels-effectively.
Now that you have created the specification, create the Service in your cluster by running:
$ kubectl create -f guestbook/all-in-one/redis-slave.yaml
service "redis-slave" created
deployment "redis-slave" created

$ kubectl get services
NAME           CLUSTER-IP     EXTERNAL-IP   PORT(S)    AGE
redis-master   10.0.76.248    <none>        6379/TCP   20m
redis-slave    10.0.112.188   <none>        6379/TCP   16s

$ kubectl get deployments
NAME           DESIRED   CURRENT   UP-TO-DATE   AVAILABLE   AGE
redis-master   1         1         1            1           22m
redis-slave    2         2         2            2           2m
Once the Deployment is up, you can list the pods in the cluster, to verify that the master and slaves are running. You should see a list that includes something like the following:
$ kubectl get pods
NAME                            READY     STATUS    RESTARTS   AGE
redis-master-2353460263-1ecey   1/1       Running   0          35m
redis-slave-1691881626-dlf5f    1/1       Running   0          15m
redis-slave-1691881626-sfn8t    1/1       Running   0          15m
You should see a single redis master pod and two redis slave pods. As mentioned above, you can get more information about any pod with: kubectl describe pods/<POD_NAME>. And also can view the resources on kube-ui.
Step Three: Start up the guestbook frontend
A frontend pod is a simple PHP server that is configured to talk to either the slave or master services, depending on whether the client request is a read or a write. It exposes a simple AJAX interface, and serves an Angular-based UX. Again we’ll create a set of replicated frontend pods instantiated by a Deployment — this time, with three replicas.
As with the other pods, we now want to create a Service to group the frontend pods. The Deployment and Service are described in the file all-in-one/frontend.yaml:
apiVersion: v1
kind: Service
metadata:
  name: frontend
  labels:
    app: guestbook
    tier: frontend
spec:
  # if your cluster supports it, uncomment the following to automatically create
  # an external load-balanced IP for the frontend service.
  # type: LoadBalancer
  ports:
    # the port that this service should serve on
  - port: 80
  selector:
    app: guestbook
    tier: frontend
---
apiVersion: extensions/v1beta1
kind: Deployment
metadata:
  name: frontend
  # these labels can be applied automatically
  # from the labels in the pod template if not set
  # labels:
  #   app: guestbook
  #   tier: frontend
spec:
  # this replicas value is default
  # modify it according to your case
  replicas: 3
  # selector can be applied automatically
  # from the labels in the pod template if not set
  # selector:
  #   matchLabels:
  #     app: guestbook
  #     tier: frontend
  template:
    metadata:
      labels:
        app: guestbook
        tier: frontend
    spec:
      containers:
      - name: php-redis
        image: gcr.io/google-samples/gb-frontend:v4
        resources:
          requests:
            cpu: 100m
            memory: 100Mi
        env:
        - name: GET_HOSTS_FROM
          value: dns
          # If your cluster config does not include a dns service, then to
          # instead access environment variables to find service host
          # info, comment out the 'value: dns' line above, and uncomment the
          # line below.
          # value: env
        ports:
        - containerPort: 80
Using ‘type: LoadBalancer’ for the frontend service (cloud-provider-specific)
For supported cloud providers, such as Google Compute Engine or Google Container Engine, you can specify to use an external load balancer
in the service spec, to expose the service onto an external load balancer IP.
To do this, uncomment the type: LoadBalancer line in the all-in-one/frontend.yaml file before you start the service.
See the appendix below on accessing the guestbook site externally for more details.
Create the service and Deployment like this:
$ kubectl create -f guestbook/all-in-one/frontend.yaml
service "frontend" created
deployment "frontend" created
Then, list all your services again:
$ kubectl get services
NAME           CLUSTER-IP     EXTERNAL-IP   PORT(S)    AGE
frontend       10.0.63.63     <none>        80/TCP     1m
redis-master   10.0.76.248    <none>        6379/TCP   39m
redis-slave    10.0.112.188   <none>        6379/TCP   19m
Also list all your Deployments:
$ kubectl get deployments
NAME           DESIRED   CURRENT   UP-TO-DATE   AVAILABLE   AGE
frontend       3         3         3            3           2m
redis-master   1         1         1            1           39m
redis-slave    2         2         2            2           20m
Once it’s up, i.e. when desired replicas match current replicas (again, it may take up to thirty seconds to create the pods), you can list the pods with specified labels in the cluster, to verify that the master, slaves and frontends are all running. You should see a list containing pods with label ‘tier’ like the following:
$ kubectl get pods -L tier
NAME                            READY     STATUS    RESTARTS   AGE       TIER
frontend-1211764471-4e1j2       1/1       Running   0          4m        frontend
frontend-1211764471-gkbkv       1/1       Running   0          4m        frontend
frontend-1211764471-rk1cf       1/1       Running   0          4m        frontend
redis-master-2353460263-1ecey   1/1       Running   0          42m       backend
redis-slave-1691881626-dlf5f    1/1       Running   0          22m       backend
redis-slave-1691881626-sfn8t    1/1       Running   0          22m       backend
You should see a single redis master pod, two redis slaves, and three frontend pods.
The code for the PHP server that the frontends are running is in examples/guestbook/php-redis/guestbook.php. It looks like this:
<?

set_include_path('.:/usr/local/lib/php');

error_reporting(E_ALL);
ini_set('display_errors', 1);

require 'Predis/Autoloader.php';

Predis\Autoloader::register();

if (isset($_GET['cmd']) === true) {
  $host = 'redis-master';
  if (getenv('GET_HOSTS_FROM') == 'env') {
    $host = getenv('REDIS_MASTER_SERVICE_HOST');
  }
  header('Content-Type: application/json');
  if ($_GET['cmd'] == 'set') {
    $client = new Predis\Client([
      'scheme' => 'tcp',
      'host'   => $host,
      'port'   => 6379,
    ]);

    $client->set($_GET['key'], $_GET['value']);
    print('{"message": "Updated"}');
  } else {
    $host = 'redis-slave';
    if (getenv('GET_HOSTS_FROM') == 'env') {
      $host = getenv('REDIS_SLAVE_SERVICE_HOST');
    }
    $client = new Predis\Client([
      'scheme' => 'tcp',
      'host'   => $host,
      'port'   => 6379,
    ]);

    $value = $client->get($_GET['key']);
    print('{"data": "' . $value . '"}');
  }
} else {
  phpinfo();
} ?>
Note the use of the redis-master and redis-slave host names – we’re finding those Services via the Kubernetes cluster’s DNS service, as discussed above. All the frontend replicas will write to the load-balancing redis-slaves service, which can be highly replicated as well.
Step Four: Cleanup
If you are in a live Kubernetes cluster, you can just kill the pods by deleting the Deployments and Services. Using labels to select the resources to delete is an easy way to do this in one command.
$ kubectl delete deployments,services -l "app in (redis, guestbook)"
To completely tear down a Kubernetes cluster, if you ran this from source, you can use:
$ <kubernetes>/cluster/kube-down.sh
Troubleshooting
If you are having trouble bringing up your guestbook app, double check that your external IP is properly defined for your frontend Service, and that the firewall for your cluster nodes is open to port 80.
Then, see the troubleshooting documentation for a further list of common issues and how you can diagnose them.
Appendix: Accessing the guestbook site externally
You’ll want to set up your guestbook Service so that it can be accessed from outside of the internal Kubernetes network. Above, we introduced one way to do that, by setting type: LoadBalancer to Service spec.
More generally, Kubernetes supports two ways of exposing a Service onto an external IP address: NodePorts and LoadBalancers , as described here.
If the LoadBalancer specification is used, it can take a short period for an external IP to show up in kubectl get services output, but you should then see it listed as well, e.g. like this:
$ kubectl get services
NAME           CLUSTER-IP     EXTERNAL-IP   PORT(S)    AGE
frontend       10.0.63.63     23.236.59.54  80/TCP     1m
redis-master   10.0.76.248    <none>        6379/TCP   39m
redis-slave    10.0.112.188   <none>        6379/TCP   19m
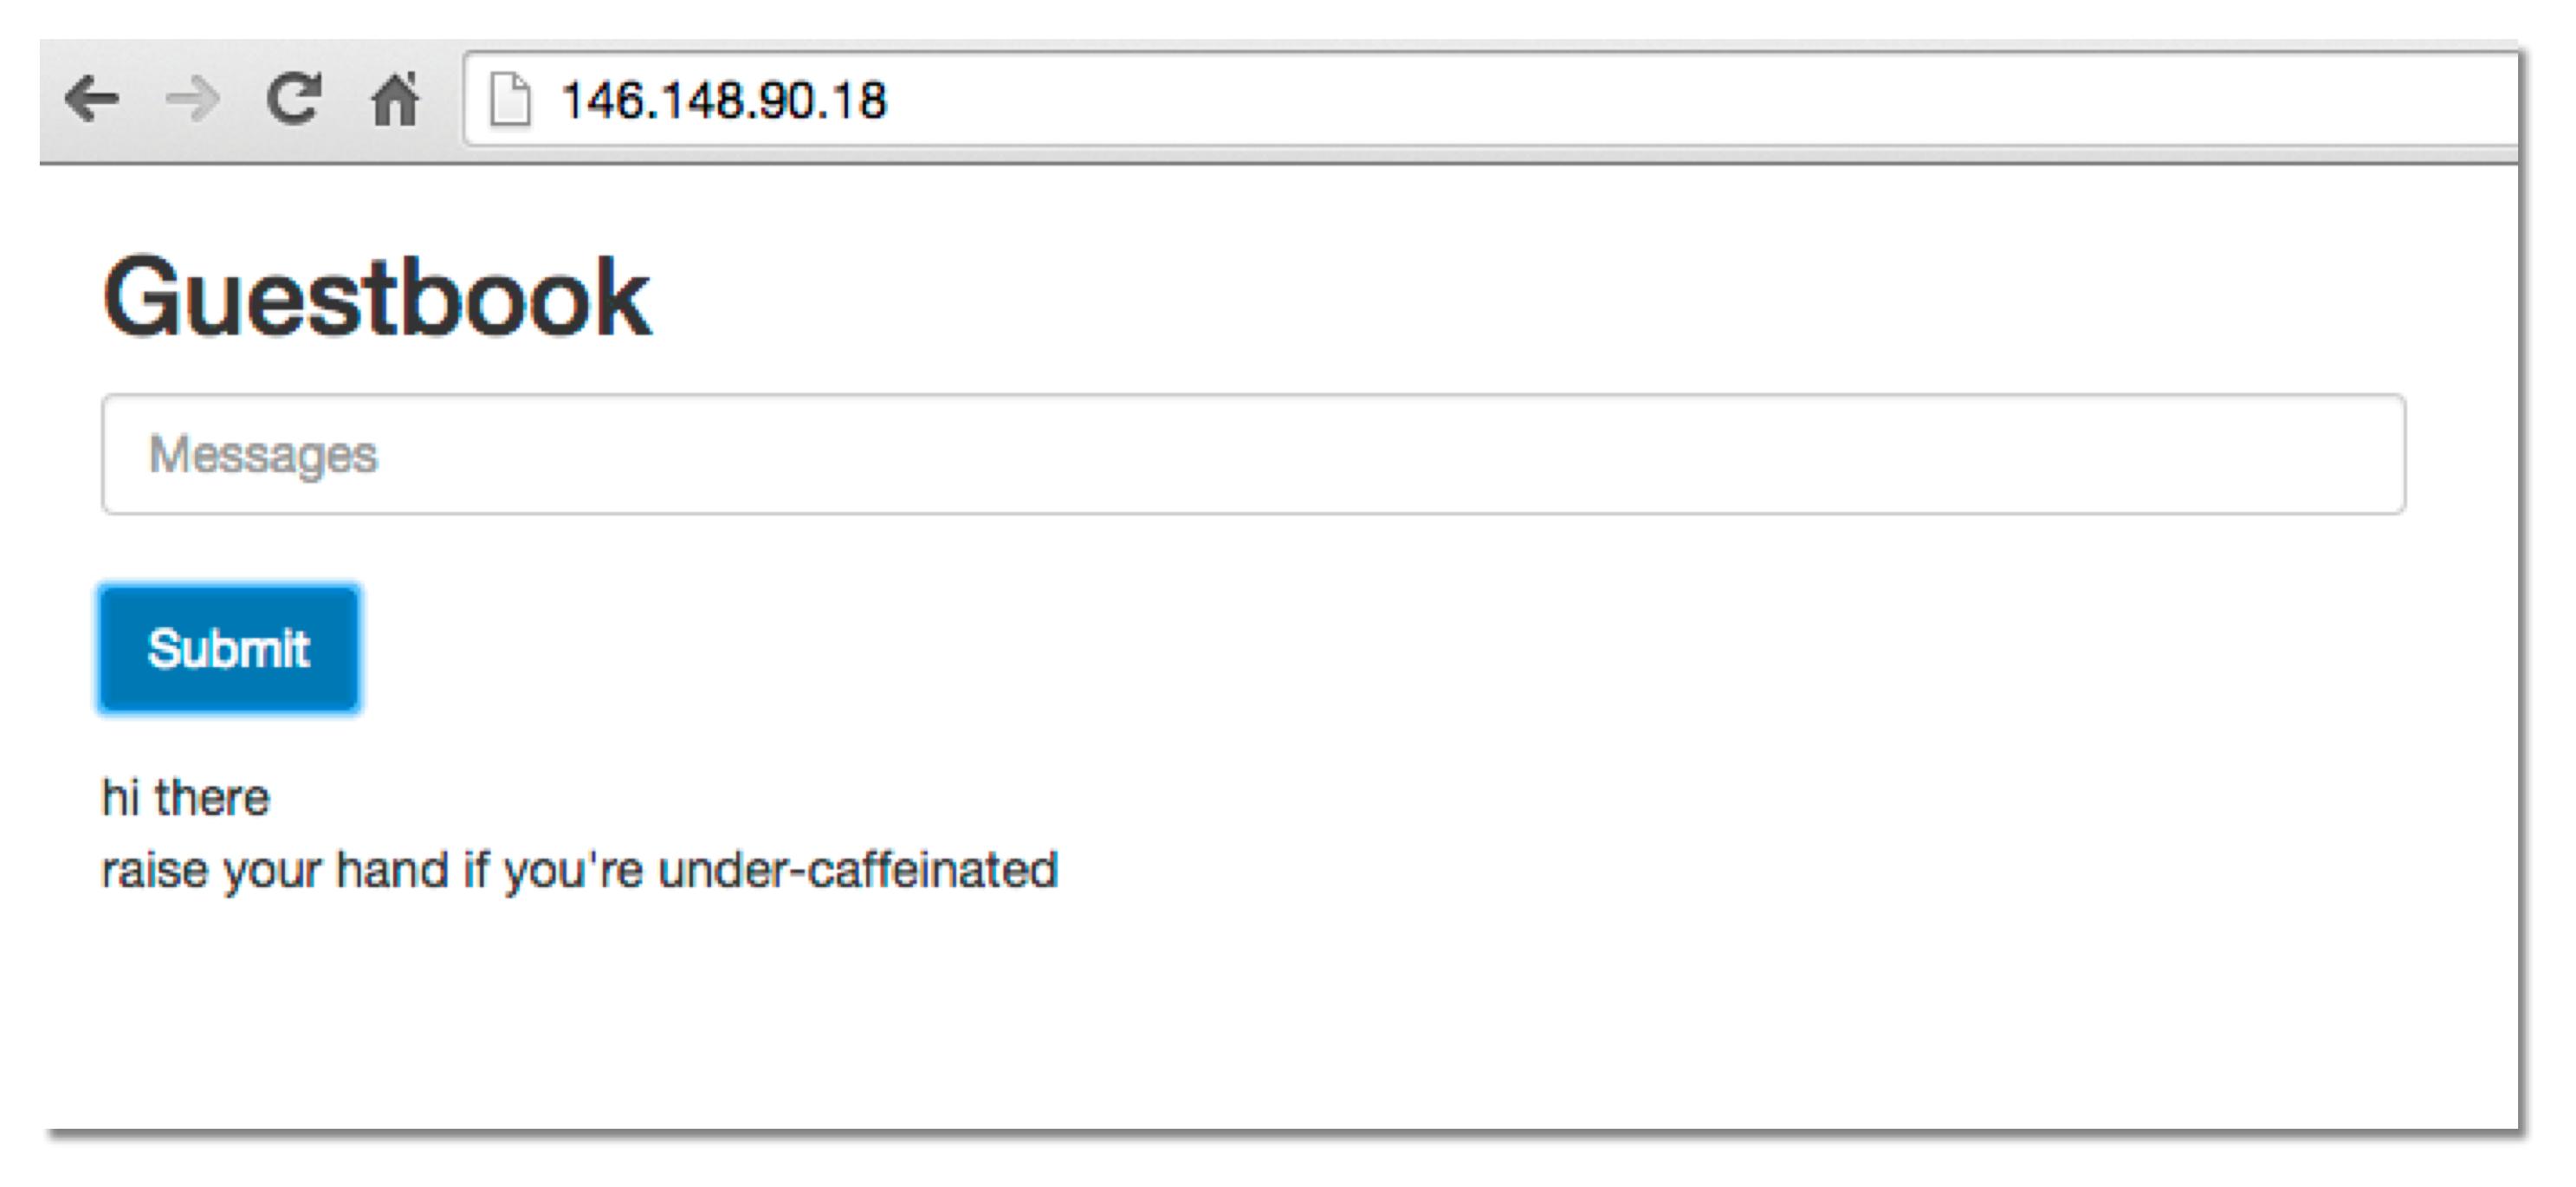
Once you’ve exposed the service to an external IP, visit the IP to see your guestbook in action, i.e. http://<EXTERNAL-IP>:<PORT>.
You should see a web page that looks something like this (without the messages). Try adding some entries to it!
If you are more advanced in the ops arena, you can also manually get the service IP from looking at the output of kubectl get pods,services, and modify your firewall using standard tools and services (firewalld, iptables, selinux) which you are already familiar with.
Google Compute Engine External Load Balancer Specifics
In Google Compute Engine, Kubernetes automatically creates forwarding rules for services with LoadBalancer.
You can list the forwarding rules like this (the forwarding rule also indicates the external IP):
$ gcloud compute forwarding-rules list
NAME                  REGION      IP_ADDRESS     IP_PROTOCOL TARGET
frontend              us-central1 130.211.188.51 TCP         us-central1/targetPools/frontend
In Google Compute Engine, you also may need to open the firewall for port 80 using the console or the gcloud tool. The following command will allow traffic from any source to instances tagged kubernetes-node (replace with your tags as appropriate):
$ gcloud compute firewall-rules create --allow=tcp:80 --target-tags=kubernetes-node kubernetes-node-80
For GCE Kubernetes startup details, see the Getting started on Google Compute Engine
For Google Compute Engine details about limiting traffic to specific sources, see the Google Compute Engine firewall documentation.